Modeling Hartree-Fock approximations of the Schrödinger Equation for multielectron atoms from Helium to Xenon using STO-nG basis sets
(1) Irvington High School, Fremont, California, (2) Modern Eğitim Fen Schools, Beşiktaş, Ulus, Türkiye, (3) Rio Americano High School, Sacramento, California, (4) The Quarry Lane School, Dublin, California, (5) Aspiring Scholars Directed Research Program, Fremont California
* These authors made equal contributions
https://doi.org/10.59720/22-211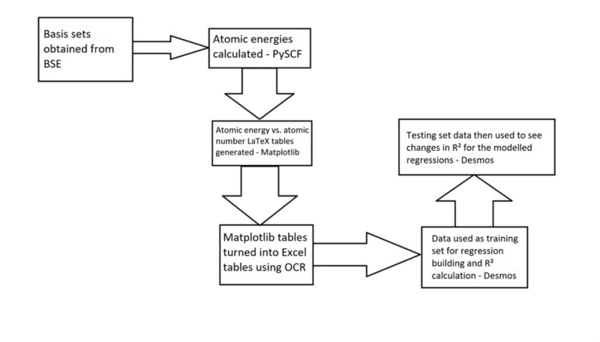
The energy of an atom is extremely useful in nuclear physics and reaction mechanism pathway determination but is challenging to compute. Thus, we aimed to synthesize regression models for Pople Gaussian expansions of Slater-type Orbitals (STO-nG) atomic energy vs. atomic number scatter plots to allow for easy approximation of atomic energies without using computational chemistry methods. Using the Hartree-Fock method, we calculated atomic energies for elements helium to xenon (He to Xe) using STO-nG electron orbital basis set models. After calculating atomic energies for each basis set, we plotted them as tables of atomic energy (in Hartrees) versus the atomic number. We hypothesized that there would be a non-linear correlation in the scatter plot. We first formed the regressions using data from helium to krypton (He to Kr), and then we added new data from Kr to Xe. We then calculated the old and new coefficients of determination, and the difference between them. Due to their common use in modeling, exponential, sinusoidal, and quadratic regressions were tested to model the data. The data supported the hypothesis that the scatter plots had non-linear correlations. Sinusoidal and quadratic regressions had higher initial coefficients, suggesting higher viability, while sinusoidal regressions also had the highest average final coefficients, and the lowest change in coefficients. The data indicated that of the three regressions, sinusoidal regressions most aptly modeled the scatter plots.
This article has been tagged with: