In this study, the authors explored whether students' test scores were significantly higher on online exams during the COVID-19 school lockdown when compared to those of the in-person exams before the lockdown.
Read More...Inflated scores on the online exams during the COVID-19 pandemic school lockdown
In this study, the authors explored whether students' test scores were significantly higher on online exams during the COVID-19 school lockdown when compared to those of the in-person exams before the lockdown.
Read More...A study of South Korean international school students: Impact of COVID-19 on anxiety and learning habits
.jpg)
In this study, the authors investigate the effects of the COVID-19 pandemic on South Korean international school students' anxiety, well being and their learning habits.
Read More...Creating a drought prediction model using convolutional neural networks
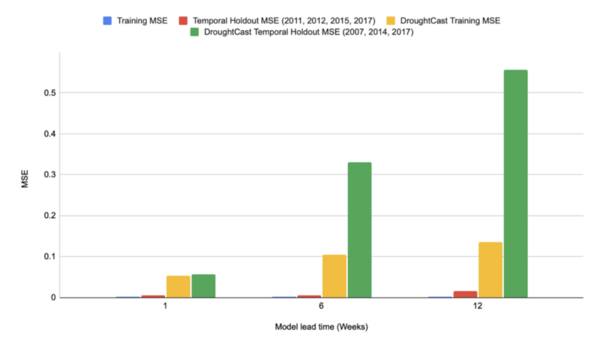
Droughts kill over 45,000 people yearly and affect the livelihoods of 55 million others worldwide, with climate change likely to worsen these effects. However, unlike other natural disasters (hurricanes, etc.), there is no early detection system that can predict droughts far enough in advance to be useful. Bora, Caulkins, and Joycutty tackle this issue by creating a drought prediction model.
Read More...Creating a Phenology Trail Around Central Park Pond
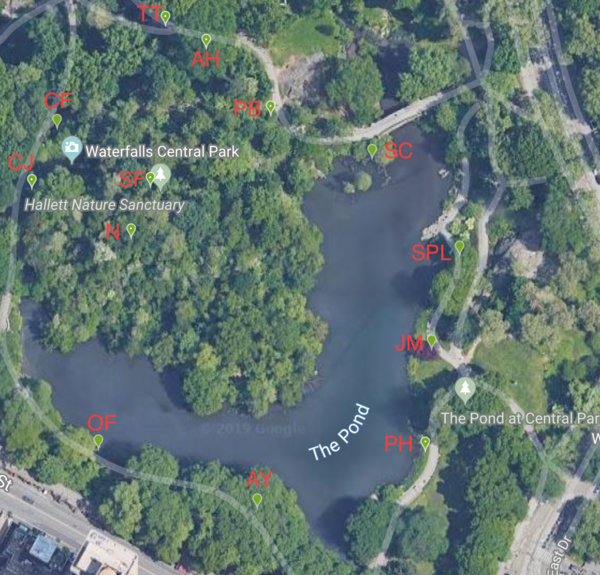
This study aimed to determine whether the life cycle stages, or phenophases, of some plants in the urban environment of Central Park, New York, differ from the typical phenophases of the same plant species. The authors hypothesized that the phenophases of the thirteen plants we studied would differ from their typical phenophases due to the urban heat island effect. Although the phenophases of five plants matched up with typical trends, there were distinct changes in the phenophases of the other eight, possibly resulting from the urban heat island effect.
Read More...Solubility of graphite and the efficacy of using its dissolved form as a conductive paste
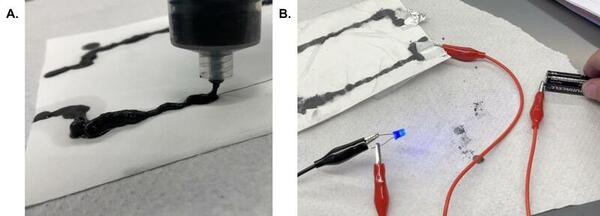
This study explored the use of graphite's conductivity for circuit boards by creating a conductive paste through exfoliation with organic solvents and sonication. The combination of acetone and sonication was found to be the most effective, producing a high-conductivity paste with desirable properties such as a low boiling point. While not a replacement for wires, this conductive paste has potential applications in electronics and infrastructure, provided that key engineering challenges are addressed.
Read More...Developing novel plant waste-based hydrogels for skin regeneration and infection detection in diabetic wounds
The purpose of this investigation is to develop a hydrogel to aid skin regeneration by creating an extracellular matrix for fibroblast growth with antibacterial and infection-detection properties. Authors developed two natural hydrogels based on pectin and potato peels and characterized the gels for fibroblast compatibility through rheology, scanning electron microscopy, swelling, degradation, and cell cytotoxicity assays. Overall, this experiment fabricated various hydrogels capable of acting as skin substitutes and counteracting infections to facilitate wound healing. Following further testing and validation, these hydrogels could help alleviate the 13-billion-dollar financial burden of foot ulcer treatment.
Read More...Development of selective RAC1/KLRN inhibitors
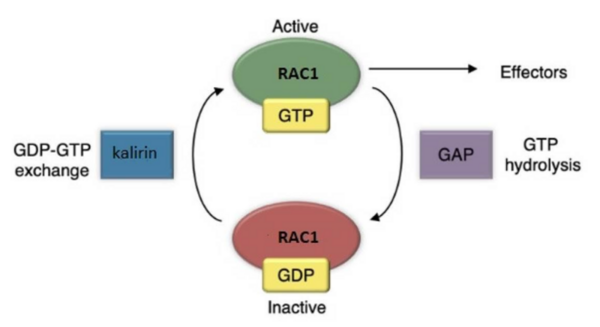
Kalirin is a guanine nucleotide exchange factor (GEF) for the GTPase RAC1, linked to schizophrenia and Alzheimer’s Disease. It plays a crucial role in synaptic plasticity by regulating dendritic spine formation and actin cytoskeleton remodeling, which are essential for creating new synapses. Authors developed two novel compounds targeting kalirin, confirming that predictive modeling can indicate biological activity.
Read More...SmartZoo: A Deep Learning Framework for an IoT Platform in Animal Care
Zoos offer educational and scientific advantages but face high maintenance costs and challenges in animal care due to diverse species' habits. Challenges include tracking animals, detecting illnesses, and creating suitable habitats. We developed a deep learning framework called SmartZoo to address these issues and enable efficient animal monitoring, condition alerts, and data aggregation. We discovered that the data generated by our model is closer to real data than random data, and we were able to demonstrate that the model excels at generating data that resembles real-world data.
Read More...Optical anisotropy of crystallized vanillin thin film: the science behind the art
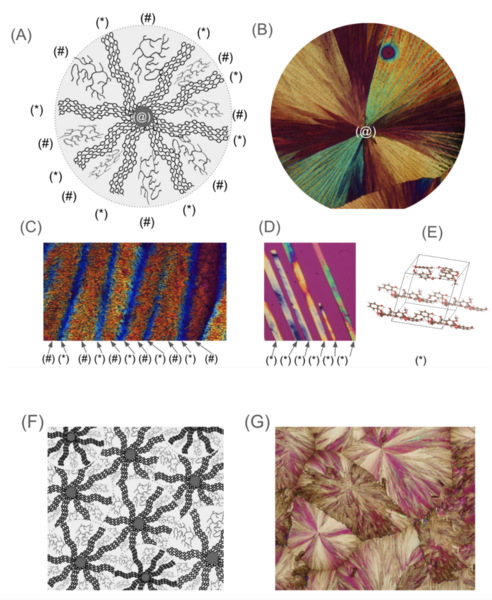
Microscopic beauty is hiding in common kitchen ingredients - even vanillin flavoring can be turned into mesmerizing artwork by crystallizing the vanillin and examining it under a polarizing microscope. Wang and Pang explore this hidden beauty by determining the optimal conditions to grow crystalline vanillin films and by creating computer simulations of chemical interactions between vanillin molecules.
Read More...Combating Insulin Resistance Using Medicinal Plants as a Supplementary Therapy to Metformin in 3T3-L1 Adipocytes: Improving Early Intervention-Based Diabetes Treatment
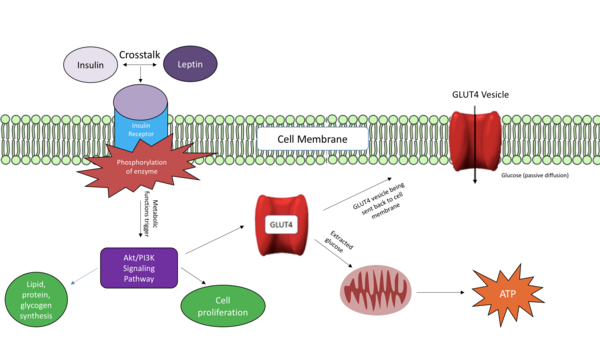
A primary cause of diabetes is insulin resistance, which is caused by disruption of insulin signal transduction. The objective of this study was to maximize insulin sensitivity by creating a more effective, early intervention-based treatment to avert severe T2D. This treatment combined metformin, “the insulin sensitizer”, and medicinal plants, curcumin, fenugreek, and nettle.
Read More...